📊 Tools Used: Power BI, Excel, Power Query, DAX
📅 Project Date: March 2025
💼 Skills Demonstrated: KPI Reporting, Trend Analysis, Data Cleaning, Interactive Filtering
🔍 Project Overview
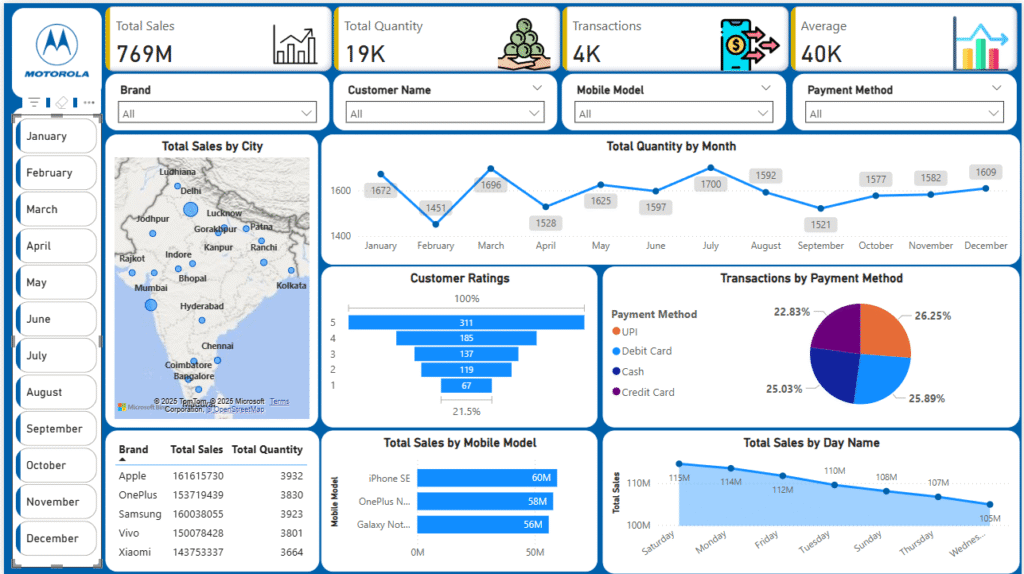
This Power BI project focuses on analyzing mobile phone sales across different regions and brands. The dataset included information on sales quantity, brand, product category, and customer ratings.
The objective was to give business leaders a clear view of which regions and products are driving revenue and how customer behavior varies across the board.
🧩 Key Dashboard Components
📍 Region-wise Sales and Quantity Sold
🏷 Top 5 Mobile Brands by Sales
💰 Monthly Sales Trend (Time-series Line Chart)
⭐ Customer Ratings by Product
🎯 KPIs: Total Sales, Units Sold, Avg Rating
🔎 Filters: Region, Brand, Month
📸 Dashboard Screenshots
🧠 Insights Discovered
- The North region led with the highest sales volume
- Brand X and Brand Y were top sellers in Tier-1 cities
- Customer satisfaction (avg rating) was highest for Brand Z
- Sales spikes occurred in festive seasons (October–December)
🛠 Techniques Used
Excel was used for pre-cleaning and formatting the raw CSV data
Power Query handled data transformation directly in Power BI
DAX used to calculate key metrics like Avg Rating, Total Quantity, Revenue
Built with a mobile-responsive layout and filter-friendly design
🔗 GitHub Repository
🙋 About Me
I’m Satyendra Yadav, a Data Analyst with a strong background in teaching mathematics and business problem-solving. I specialize in creating dashboards and data stories using Power BI, SQL, Excel, and Python.