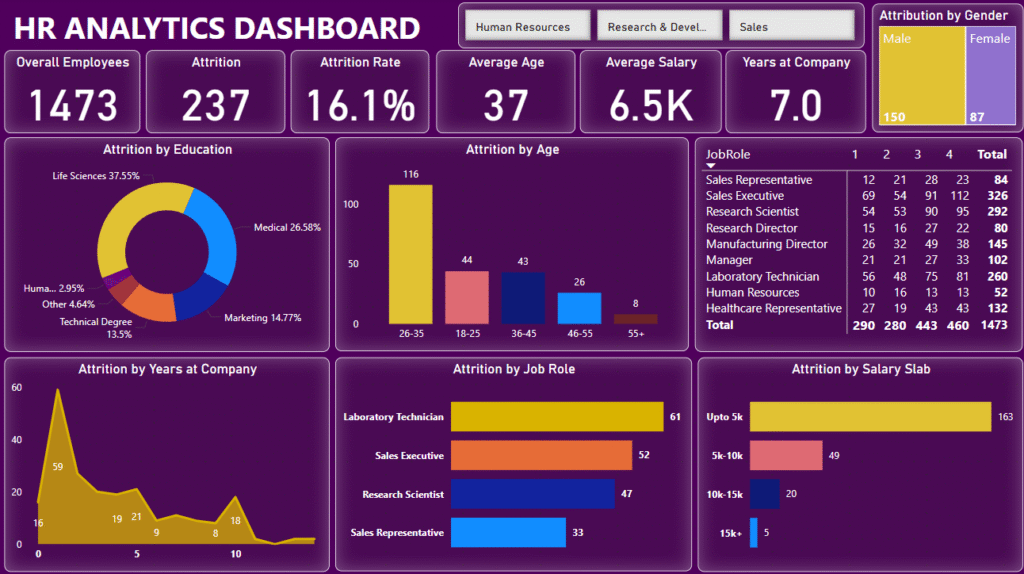
HR Analytics Dashboard – Power BI

📊 Tools Used: Power BI, DAX, Power Query
📅 Project Date: June 2025
💼 Skills Demonstrated: Data Cleaning, KPI Design, Slicer Filters, Visual Storytelling

🔍 Project Overview

This Power BI project analyzes HR data to extract meaningful insights related to employee demographics, attrition trends, and department-wise performance.
The goal was to help a fictional HR team identify areas with high attrition and optimize workforce planning.

🧩 Key Features of the Dashboard

📈 Overall Attrition Rate, Gender Ratio, and Department Size
💸 Average Monthly Income per department
📊 Dynamic Filtering by Job Role, Gender, Education Field
📅 Trend Analysis over months/years
🔎 Slicers to drill down by Department and Marital Status

🧩 Key Features of the Dashboard

🧠 Insights Discovered

– The highest attrition was found in the Sales Department
– Employees aged 26–35 were leaving the most
– Job Satisfaction scores were low among those who left
– R&D had the highest average income

🔧 Tools & Techniques Used

– Power Query for data transformation
– DAX to create KPIs like `Attrition %`, `Avg Salary`, etc.
– Card visuals, Bar Charts, Tree Maps
– Interactive Slicers and Filters

🔗 GitHub Link

🙋 About Me

I’m Satyendra Yadav — a Data Analyst and former math teacher with 2.3 years of experience. I’m passionate about transforming raw data into business insights using Power BI, SQL, and Excel.

View All Projects | Download Resume

Scroll to Top